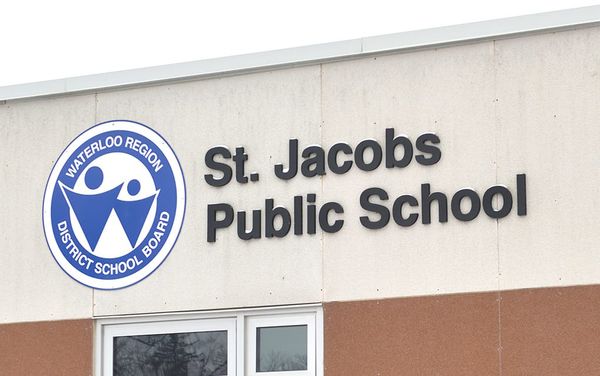
St. Jacobs PS was the highest-ranked of the area’s school in the latest report card released this week by the Fraser Institute.
With an overall score of 7.9 out of 10, St. Jacobs PS ranked 334 out of 3,046 schools graded in Ontario.
The test takes nine academic-based factors into account to calculate the final score, including the reading, writing, and math exam results of the Education Quality and Accountability Office (EQAO). With the average value being 6 out of 10, St. Jacobs PS has consistently performed well – 8.0 in 2017, and 7.1 in 2016. In particular, the school’s reading ability is strong in both Grade 3 and 6.
“The report card is a valuable tool for parents and educators because it allows them to easily identify successful schools across the province – serving similar students and communities – that can serve as an example to follow,” said Peter Cowley, a senior fellow with the Fraser Institute’s School Performance Studies in a statement.
The report ranks more than 3,000 Anglophone and Francophone public and Catholic schools, as well as a small number of independent schools. Other local elementary schools that performed well include Conestogo PS at 7.5, St. Clement at 7.2, and Wellesley PS at 7.1.
However, the report card has been met with controversy over the years since it first started in 2003. Critics say that the results do not take many other variables into account, including family income and students with learning disabilities. It also does not measure any student athletic or art scores, exclusively focusing on reading, writing, and math.
Staff at the Fraser Institute maintained that it is meant to be used more as a motivating tool.
“All too often, principals and teachers try to excuse a school’s poor overall performance by blaming the characteristics of its students or the communities they serve, but the report card shows that any school, no matter where it’s located or what challenges its students face, can succeed,” Cowley said.
The latest release from the right-wing think tank covers elementary schools, with a report on secondary schools to come at a later date. EDSS performs very well on this test, scoring 8.5 last year.
The results are relative. For example, a perfect 10 does not mean a school scored 100 per cent on the EQAO. Instead, it would show that a school performed comparatively better than other schools. The comparative nature of the report card can help schools to improve their overall test results, said senior policy analyst at Fraser Institute Angela MacLeod.
“It’s a bit of a report card for educators as well,” said MacLeod. “If they see a similar school to them in a different area that’s doing really, really well, while their own school is struggling a bit, why can’t they get on the phone to that principal and see what they’re doing that’s different?
“We try to identify schools that are doing interesting things, or seeing big gains.”
Parents are a demographic that may find the results interesting.
“It’s information that parents find really helpful,” said MacLeod. “That either when they’re choosing a school the first time, or they’re having a look and examining how their school is doing year after year, and have the opportunity to compare it to similar schools.”
While the results may be interesting, it is a relatively small factor to take into account when choosing a potential school. Other variables include proximity, individual needs, Catholic versus public, private versus non-private, and specific programs.
For a detailed list of the report card, visit Compare School Rankings online.